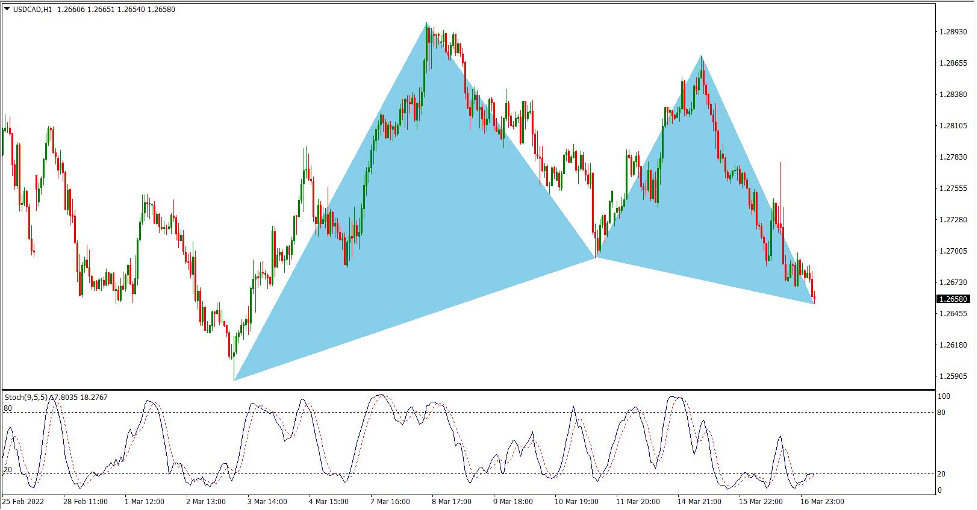
Harmonic patterns are 5-wave structures that form at precise Fibonacci levels.
There are different types of Harmonic patterns, such as Gartley, Butterfly, Bat, Crab, Shark etc. (Yes, they sound very exotic). I have seen traders shy away from these patterns, thinking they are too complicated, or so exotic that they cannot work. However, in reality, these Harmonic patterns are not as complicated as they sound & can give a huge trading advantage - if one knows how to trade them.
Basically, they work on the same principle of ‘shaking out the stops’ by the experienced (professional) traders & one just needs to understand the principle behind the price movement that forms these patterns.
This is exactly what we do - break down complicated patterns into simple, easy to understand steps, so that a trader understands the “Law of the Charts”.
Which is what I will be covering in my ‘Master Class’ at the #IX Investor Show, understanding the ‘Divergence’ pattern & breaking it down into simple steps, to form a precise Trade Plan.
Harmonic patterns have a huge advantage since they respect the Fibonacci levels precisely.
Unlike the Elliot waves, which can be subjective. Elliot waves are the building block of price pattern, which are based on the 5-wave & 3-wave structure, as expounded by the Dow Theory. But the issue with Elliot waves, is the structure has many sub waves within it making it complicated. Add to the fact, that one needs to know where to start the wave count, which is not easy in a continuous price movement.
There is a joke, that if you give a chart to 10 “Ellioticians”, you will get 10 different wave counts…..and all of them will be correct! This is not the case with Harmonic patterns, which tend to respect Fibonacci ratio levels precisely. One can take advantage of this fact to estimate where price can go.
Taking this into account, let me put down a stark difference on how I trade the Harmonic patterns, vis-à-vis how these patterns are normally traded.
Most traders tend to wait for the 5-wave structure of the Harmonic to complete, identify the particular pattern & then trade the same.
I trade within the 5 waves of the Harmonic pattern, for the simple reason that we have a high probability of price reaching a particular Fibonacci level.
Let’s take a perfect example of a recent trade –

Chart 1:
As seen, price respected the Fibonacci 61.8 support level at pt.B.
Subsequently, price respected the Fib 78.6 resistance level at pt.C.
This gave us a high probability setup that price could move down to a certain level (which as per the Harmonics) would be a combination of 2 different Fibonacci levels (the pt.D marked on the chart)

Chart 2:
Price moved nicely in our favour & as per our trade management rules, we took profits on half the position & moved the stop to entry.
At this stage, we were in a free trade, having locked in 50% profit and eliminating the risk completely.

Chart 3:
This was one of those smooth trades & price effortlessly moved down to the target where it closed for handsome profit.
Are all trades perfect like this? Certainly not. But the probability of success is much higher - which is the edge that traders need to have.
But let’s make one point clear. These Harmonic patterns based on the Fibonacci ratios are just guidelines. We must use these “tools’ as an estimate to plan a trade, but entering a trade involves other factors. Looking at this trade for instance, when we placed the Sell at pt.C, did we know for certain that price would move down? Even using Fibonacci levels? No, we could not be sure.
But we use other tools which gave us a higher probability that price could move down.
These are proprietary tools developed specifically for every technique, that give the ‘high probability’ edge.
Understanding price action & using the correct technical tools available, is the edge a trader must have to grow the account.

Thanks for sharing information
https://www.xtreamforex.com/